
Excel Oil Pipeline Applications are Imperative to the Oil & Gas Industry
If you are struggling to find a cost effective way to analyze and use your inline pipe inspection data, contact us at Excelhelp.com. We have worked on pipe inspection data for several companies and have proven our ability to understand the requirements and provide solutions that work. We have built this solutions for the Energy, Mining, Chemicals, Water and Wastewater Industries.
Identifying Pipeline Integrity Issues with Inline Inspection Data
Managers who are responsible for monitoring pipeline integrity are known to heavily rely upon data from inline inspections in their decision making processes. Typically, current inline inspections are compared with prior inline inspections to determine the metal loss rate at various locations in the pipeline. Knowing the severity of the metal loss and the characterization of other anomalies found during inline inspections, managers can identify pipeline integrity issues and prioritize maintenance activities.
Challenge: Matching Inline Inspection Data
The primary challenge with comparing current inline inspection data to prior inline inspection data is comparing apples to apples. Both the location along the length of the pipe and the location around the diameter of the pipe are important to match when comparing the wall thickness and calculating metal loss. This seems simple enough, but when considering that some inspections involve miles of pipeline and mechanical robots with sensors that move inside the pipe, there are many ways that error can be introduced.
Solution: Use Excel for Inline Inspection Data Alignment
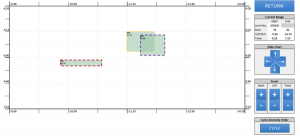
Before any data analysis and decision making can be conducted, data from subsequent inspections must be aligned or matched up. The inline inspection data sets provide many clues that help with aligning a majority of the data. These clues can be incorporated into a data alignment algorithm. After this algorithm is run, there are usually still some data points that remain unmatched. A visual data match interface, such as the one shown below, can be provided to help the user match up the remaining anomalies.
Challenge: Identify and Prioritize Pipeline Anomalies
Once the pipeline anomaly data is matched, calculations of metal loss and other metrics are conducted. These calculations are then used to rate the severity of each anomaly. A well-designed Excel application can automate this work and present the managers with easy to understand reports.
Challenge #2: Minimize the number of “Digs”
In the case of buried pipeline, there is a large incentive to make as many repairs as possible with a single “dig.” Even with aboveground pipeline, addressing issues efficiently helps keep the costs down. As a result, sometimes less critical repairs are completed at the same time as more critical repairs because they are in close proximity to where the work will be conducted. In Excel, functionality can be provided to present the manager with information on all the anomalies surrounding a critical anomaly so that the manager can decide which ones to address in a single “dig.”
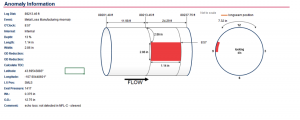
Data Visualization for Dig Team
Once the manager has decided which anomalies to address in a single dig, clear information needs to be provided to the repair personnel. In Excel, drawings such as the following can automatically be generated based on the anomaly data.
Contact ExcelHelp.com for A Free Consultation
Let us help you design and develop a custom Excel solution. Contact our team to schedule a free consultation by using our contact form here.