
There are 1,048,576 rows by 16,384 columns in a single worksheet. The total number of characters that one cell can contain is 32,767. There are 16 million colors to choose from in a workbook.
The most limiting aspect of Excel is the available memory on a computer, something the system has no control over.
With an almost boundless system, there is huge potential.
So while Excel might be best known as a complex spreadsheet to look up employee’s phone numbers or commission rates on sales, its uses can actually be vastly unique and extensive. You just have to tap into all the unused potential.
There is a zealous, devout following of the unorthodox use of Excel as the Swiss Army knife of Office systems. Take this article as your induction. Drink the punch and be prepared to soon praise Excel as the only tool you need.

A friend of mine had her own Excel awakening not too long ago. As an account executive in a well-established Philadelphia Public Relations company she sometimes would say that her business card should actually read, “Master Spreadsheet Maker.”
Her job requires many skills, but by using the program everyday she learned how to manipulate it for all her needs, which made her more productive and organized.
As easy as it is to find a computer equipped with Excel, it is just as easy to incorporate Excel into almost everything.
So now you may be thinking,“What can the Swiss Army knife of Office systems do for me?”
Well, let’s look at some little-known, unexpected, and crazy ways Excel can be used.
Little-known:
Conditional Formatting
What: Using formulas and a few, simple settings you can create a dashboard from your spreadsheet.
Why: A dashboard allows information to be displayed at a glance. Use it if you are trying to manage time spent on tasks (like counting inventory or orders) to increase productivity or if you are trying to stick to a diet plan but want to simplify all the calorie counting so it’s less stressful. Those are just two examples of the wide range of potential applications.
How: home tab > conditional formatting icon
From there, many options will become available. You might already be familiar with the shading and coloring in of cells based on their data. However, the dashboard function will simplify things even further.
home tab > conditional formatting > icon sets
Choose a set of the indicator lights then click on “Manage Rules” (this is also in the conditional formatting drop down menu). A box will pop up and, depending on the data you selected before choosing the icon set, you’ll see the cell indicated in the manager window with the icon set you just chose.
The next step is to click on “Edit Rule.” You will be able to create a formula here that will display the icons as you wish.
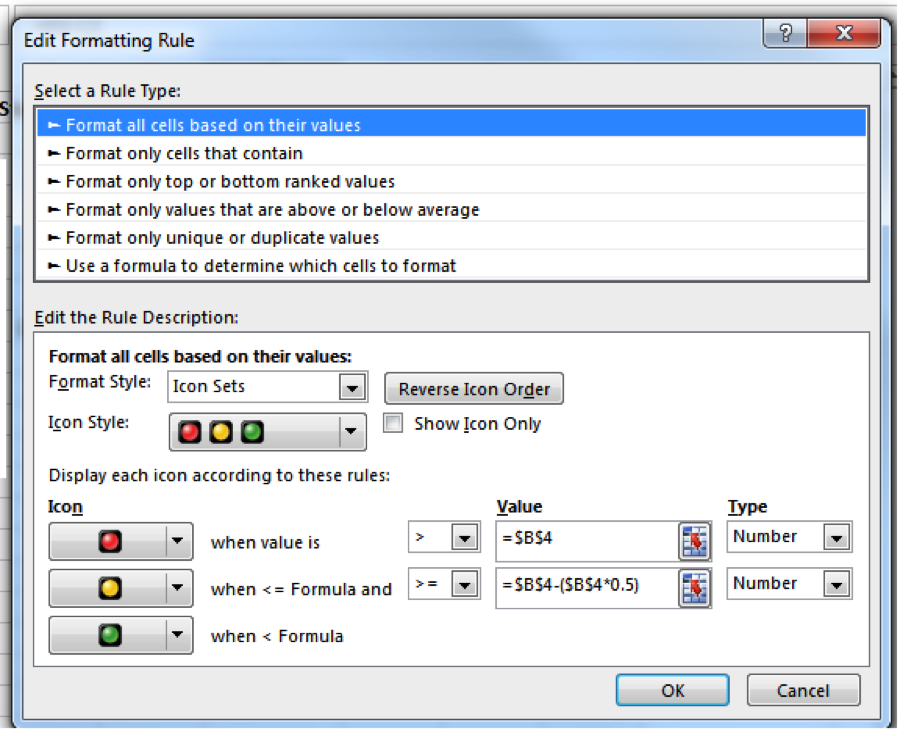
For example: Say you are managing a diet. If you go over your allotted calories for the day but by less than 500 then the yellow light icon will be displayed. If you go over your allotted calories by more than 500 then the red light will appear, and then if you stay within your allotted calories a green icon will be shown.
Now you can glance at the spreadsheet to see if your diet is on track, rather than needing to inspect the numbers up-close. Great way to save time!
Unexpected:
Activate the Analysis Toolpak
What: Hacks for however you choose to use Excel.
Why: Let’s face it, there are many unexpected ways Excel can be used. You just have to think about the data you have and what you want to do with it. Then you can essentially use Excel in any capacity.
What might be less expected is that you don’t have to spend a lot of time fixing formulas and analysing data.
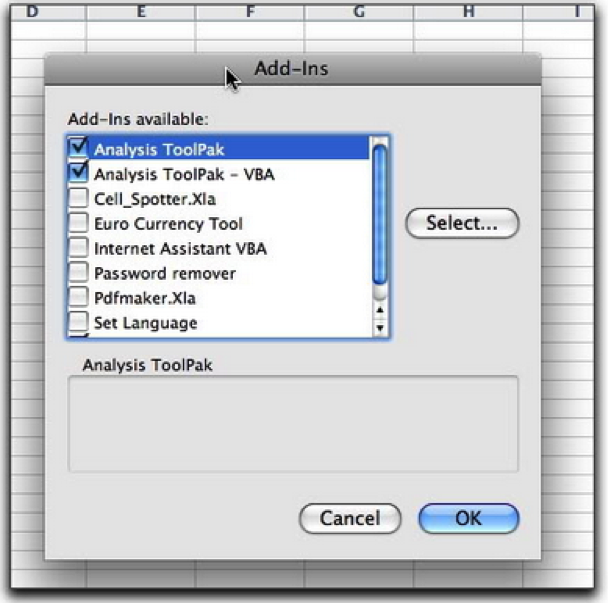
How: Activate the Analysis Toolpak, which is built into Excel but not automatically turned on.
If you need to do any type of statistical analysis then this add-on will help you do it fast.
On the Tools menu, click Add-Ins and then click to select the Analysis ToolPak check box. Click OK:
Or you can use F9 to test formulas. This can save you hours in testing to resolve bugs and errors.
Let’s say you have a set of items, where one is giving you an error:
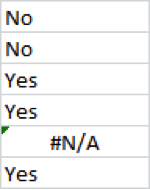
Normally in this situation it would require playing around with inputs to identify where the problem is, then figuring it out by process of elimination, but F9 saves the need to do that.
First click onto the formula bar:
![]()
Next, select particular arguments in the formula (simply put: anything with a comma after it):
![]()
Then, tap F9 and you will see not the argument but the result of the argument (the number or cell flowing through to it). If there is an error in that particular selection it will also show. You will immediately know the source of the problem:
![]()
Finally, you can hit Esc to undo.
Crazy:
Creating Art
What: Inserting images or creating artwork one cell at a time.
Why: No, this is not for all those times you are bored at the office with no internet access (We will get to that).
Educators and presenters are using art in Excel to gain attention and retention of their class and audience. By incorporating images and design into the spreadsheet, the lists of values become less daunting and more interactive. It is quite easy to incorporate graphs but getting artistic with them as well can boost interest in the material.
Diagrams can be created through the tool AutoShapes in Excel, as well. Todd Michael Edwards uses Excel to provide training for pilots around the world on planes ranging from regional jets to Boeing 747s.
But you could also use it to become a famous artist.
How: Maybe you have heard the name Tatsuo Horiuchi.
A 75-year-old Japanese artist, Horiuchi creates his masterpieces through a unique medium: Excel. Using AutoShapes, a tool in Excel that lets users connect and color custom shapes, Horiuchi builds massively complex images that push the limits of spreadsheet software.
Here is how to access the AutoShapes toolbar and position it as a floating toolbar for easy use:
1. Display the Drawing toolbar. (Click on the Drawing option on the Standard toolbar.)
2. Click on the AutoShapes option on the Drawing toolbar. The AutoShapes menu appears.
3. Position the mouse pointer over the bar at the top of the AutoShapes menu.
4. Click and drag the AutoShapes menu away from the Drawing toolbar.
5. Release the mouse button. You now have a floating AutoShapes menu!
So, why did Horiuchi choose a spreadsheet system as his canvas?
Seems like an interesting choice out of all the other options available. Well, he chose it because Excel is often readily available on the majority of computers and because when he bought the system it was cheaper than an Adobe design program.
It was back in 2006 when he first gained attention for his artwork, by entering and stunning in an Excel AutoShape art contest (yes, this is a real thing).


Skeptical? See Horiuchi’s methods up close by downloading one of his actual Excel files.
Playing Video Games
What: Arena.Xlsm
Why: Because sometimes you just want to have a little fun at the office (Finally!).
How: Let’s all give a big round of applause to Cary Walkin, who created a full-length role-playing game using an Excel workbook.
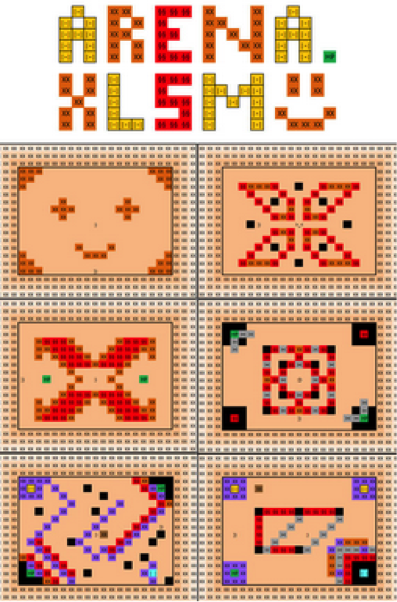
It’s available on PC versions of Excel 2007, Excel 2010 and Excel 2013. To download the game, click here.
Conclusion:
The most important take-away is that working with Excel does not have to be limited to business BUT when used for work it can have unlimited possibilities.
This is a platform that allows for creativity – whether that be creative ways to manage data or actually crafting a piece of art.
If there is one program that should not be underestimated it would be Excel.
Keep the Swiss Army Knife of Office systems in your back pocket and you’ll survive any scenario.
Want more interesting articles on Excel? Click here to get helpful tips, news, and more.
Is there a completely unique way you have used Excel recently? OR something unique you wish you knew how to use Excel for?
Comment below!