Intermediate Pivot Table Usage in Microsoft Excel
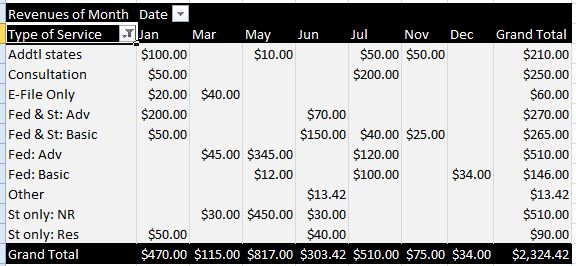
In this article we will build n the first three articles in our series on PivotTables to build the more advanced Table shown below using Column Labels and Grouping.
As you remember, we are telling the story of a hypothetical entrepreneur with his own tax-preparation business. In our first two articles, we helped him construct a PivotTable to show the number of sales he made to each of his customers, and the total of those sales in dollars.
Now, the year has ended and it is time for the entrepreneur to prepare his own taxes. In order to do so, he must know two key numbers: Total Sales and Total Costs. Then, the difference will tell him his taxable profits.
He could easily sum the worksheet with all his sales. But after having so much fun with the first PivotTable, he realizes the potential to perform more business analysis in the course of gathering his tax figures. He would like to know his sales by type of service, organized over time of the year.
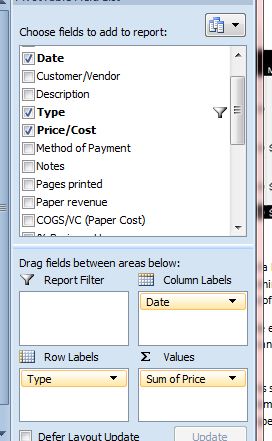
In the PivotTable fields, we replace Customer with Type of Service in the Row Labels, keep Sum of Price field in the values area, and add Date to the Column Labels.
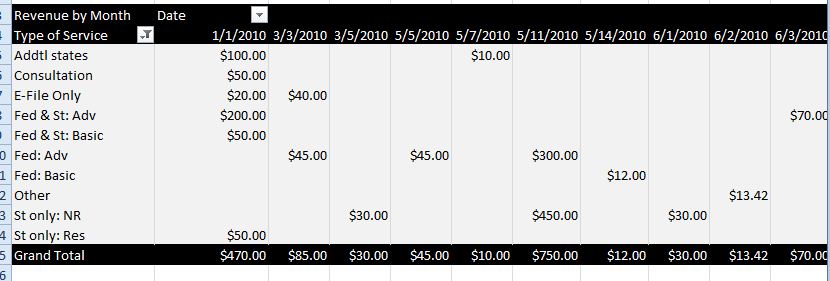
This gives us a PivotTable with too many columns for a quick analysis—one for every date on which a sale was made. PivotTable’s built-in grouping tool can solve this problem for us.
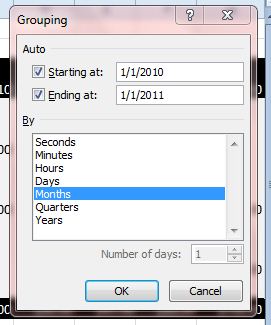
By grouping, all of the dates can be condensed into groups by quarter, month, year, etc. He decides to group by month. You can access grouping in several ways, including the PivotTable Options Ribbon, but the easiest way is to right-click in the Date field (on any date listed as a column heading). This will give you the grouping window. Detecting that all your data is in a date format, Excel gives you several time period choices.The business owner wants to see his data in months.
We have now arrived at our Total Sales figure. In order to calculate Total Costs in the same fashion would require a similar PivotTable. In our next lesson, we will take advantage of these features and more to build an automatic profit and loss statement for the tax-preparation company within one PivotTable.