It’s common for organizations to start out with a simple Excel spreadsheet to manage their staffing needs. As the organizations grow and the staffing and reporting requirements become more complex, these simple spreadsheets can then be transformed into Excel applications with an amazing amount of functionality. At eSoftware Associates, our expert VBA developers have created customized Excel staffing applications for firms in construction management, manufacturing, and healthcare.
Five Key Features of an Excel Staffing Application
- Forecasting Human Resource Needs
- Forecasting Human Resource Availability
- Allocating Human Resources to various Projects, Locations and Business Unit
- Comparing Allocated vs Needed Staff
- Generating Reports for Management and Regulatory purposes
Our team can help get the customized Excel solutions for forecasting, scheduling, and analyzing your staffing needs.
Step 1: Forecasting Human Resource Needs
Excel is great for developing forecasts, whether they are based on simple counts and ratios or more complex models. Models can be developed for individual projects, locations or business units. Then, these separate models can be aggregated using native Excel functionality or VBA code, depending on the complexity. Aggregate data is then fed into the subsequent steps.
Step 2: Forecasting Human Resource Availability
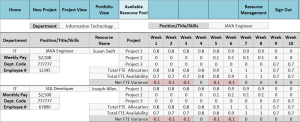
With PTO, holidays, conferences, training and other demands that pull people off the job, it’s important to have the availability of your resources at your disposal. If your firm is large and this information is stored in a separate database, it can be pulled into Excel with a data connection or an export/import procedure. If your firm is small, an interface can be provided to enter this information directly into Excel.
Step 3: Allocating Human Resources to various Projects, Locations and Business Units
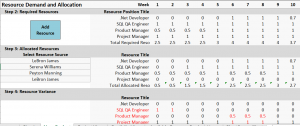
Here is where the fun begins. For each project, location or business unit, you get to pick who you want on the job and when. Alternatively, you can provide us with logic so we can have fun developing an algorithm for use in assigning people automatically. Either way, a single person can only work up to one FTE per day. Unless, of course, you like to work your people at, say, 120% FTE. At some point there is a limit to how much a single person can work before you will have to assign another resource to fill the need. That limit will be part of the logic that you will need to provide us, if we automate this process.

Step 4: Comparing Allocated vs Needed Staff
Here is where Excel does a really great job. With the data from Steps 2 and 3, nice visualizations can be created to let you quickly determine where you are over or under staffed.

Step 5: Generating Reports for Management and Regulatory Purposes
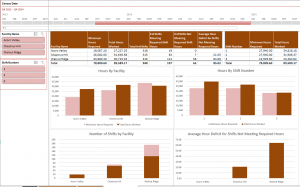
Finally, with all the data in one place, Excel can create all the reports you need at the click of a button. No more pouring over different spreadsheets for hours trying to figure things out. Patient care facilities rely on our applications to show them how they are doing in meeting the documented and required hourly care needs of their patients. These facilities not only need to ensure they are managing their staffing according to their own company policies, but they also have to maintain adequate staffing to meet regulatory requirements.


ESW is a professional Microsoft Consulting firm specializing in Excel, SQL & Office365. Contact us today for a free chat regarding your Microsoft Excel consulting needs.
