
Excel is excellent for analyzing data, and frequent Excel users know how well it works to gain valuable business insights. But Excel does come with some limitations. For example, as the amount of data keeps increasing, the capability of Excel to manage it all keeps depleting. Or, if you need to analyze data that need to be retrieved from different sources, Excel would not be able to do it. In short, your time, as well as your efficiency, both will suffer.
So what can you do if your data exceeds the 1 million rows count or your data is scattered around various data sources? Use power Pivots with Excel and get in touch with ExcelHelp’s Excel Support Services, who will guide you through the complete process of using Excel and Power Pivots. It is the Microsoft solution to manage humongous amounts of data sets with absolute ease.
I would repeat that Excel is an excellent and robust software on its own. It can do numerous tasks with efficiency. However, one can’t deny that Power Pivot is one of the most influential and significant Excel tools on the market. Why? Power Pivot has remodeled the way users – primarily companies – can input, analyze, view, and use information.
What is a Power Pivot?
Power Pivot is a free add-in for your spreadsheet to combine multiple datasets from various sources. You do not need to juggle between multiple workbooks as it will allow you to bring all data into one place. In addition, it gives you various options to create more sophisticated data models. Power Pivot is one of three data analysis tools available in Excel that are Power Pivot, Power Query, and Power View.
As Microsoft explains, Power Pivot for Excel “enables you to import millions of rows of data from multiple data sources into a single Excel workbook, create relationships between heterogeneous data, create calculated columns and measures using formulas, build PivotTables and PivotCharts, and then further analyze the data so that you can make timely business decisions without requiring IT assistance.”
Power Pivot supports Excel 2019, 2016, 2013, and 2010 and Excel in Office 365. To use Power Pivot, you do not need any technical onboarding; you need to enable it to leverage its full functionality. Once that’s done, Power Pivot can help you execute various beneficial tasks.
How to enable Power Pivot?
Step 1
Be sure that you are using Excel version 2010 or above. You can find the version by going to File » Account.
To enable Power Pivot Go to File » Option » Click Add-ins.
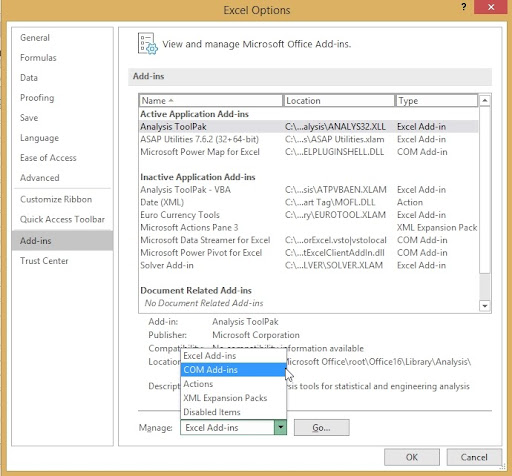
Step 2
Select COM Add-Ins and click Go » COM Add-Ins list; a Dialogue box will pop up.
After clicking on Go, tick the box which is next to Microsoft Power Pivot for Excel. And now your Power Pivot is enabled in MS Excel.
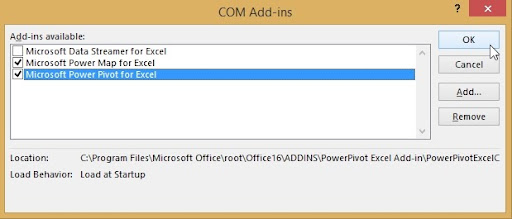
Notice you can find the Power Pivot tab on the Ribbon.
Let us have a look through what you can do with Power Pivot?
1. Analysis of a large amount of data
With Power Pivot for Excel, technically, there is no limit on how much data you can process. But you will have to consider the Excel version you are using and if you need to publish the spreadsheet to Sharepoint.
If you’re using the 64-bit version of Excel, Power Pivot can handle around 2 GB of data, but you should also have enough RAM to support the process smoothly. If you plan to use the Pivot-based spreadsheet to SharePoint, be sure to check the maximum supported file size.
The best way to make full use of this tool is to get in touch with ExcelHelp’s Microsoft Excel Experts.
2. Import data from various sources
Power Pivot enables you to import data from any data source, combine various datasets and do the analysis in a few hours. One of the most significant advantages of this feature is that it can help you import data from a valuable data source: SharePoint List. You need a few clicks, and information from a SharePoint List and SQL server can be combined.
3. Use DAX to Create Calculated Fields:
DAX (Data Analysis Expressions) is the formula language of Power Pivot tables. They are very similar to Excel formulas and are explicitly used in creating calculated columns. For example, using DAX date functions can help make date fields more useful. For instance, in a Pivot Table in Excel that includes a correctly formatted date field, you can use it to filter data by year, month, and day.
4. Help analyze rapidly changing data
Organizations often need to work with data that changes frequently. Power Pivot enables its users to manipulate data inputs, create relationships, and better understand the company’s whereabouts. It also allows users to create interactive visual charts that you can view in Excel worksheets.
A quick comparison of Power Pivot vs. MS Excel
- Power Pivot lets manage and manipulate hundreds of millions of rows of data, whereas Excel has a limitation of a million rows.
- Power Pivot enables you to import data from various sources into one source workbook without creating different source sheets.
- Power Pivot lets you manipulate a humongous amount of imported data from various sources without slowing down your device. Still, Excel tends to slow down your system as the amount of data increases.
- Power Pivot lets you visualize and manage your large datasets with PivotCharts and Power BI, where basic Excel lacks these abilities.
Everyone loves Excel, and it is undoubtedly the most versatile solution that businesses can think of. But what companies don’t often realize is that this tool has a lot to offer at different stages of their business. So they need to connect with experts in the field, specifically, the Microsoft Excel Experts who know the software in and out.
Get In Touch With Microsoft Excel Experts Now!