
The business world is very dynamic, and one needs to keep up with changing trends to sustain in the market. For instance, the pandemic transformed how companies function and pushed them to adopt technologies that support distributed and hybrid infrastructure. It implicates that organizations need to be open about adapting to upcoming technologies and at the same time be vigilant about technical options that can help improve their existing systems.
Microsoft products have been a backbone for corporations for a very long time as it keeps getting better each passing day. Also, Microsoft keeps rolling out new features for its existing applications while also releasing new platforms to accommodate the changing needs of organizations. In addition, many Excel development services exist to help businesses use tools like MS Excel and customize them to match their ever-changing business needs.
Microsoft also has other tools, such as Power BI, which is also known to provide a lot of operations to help businesses.
What is Power BI?
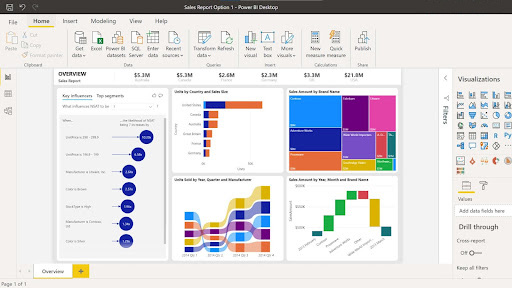
Power BI is a compilation of software services, apps, and connectors that help you present various unconnected data sources into visually attractive and interactive insights.
The most significant benefit of using Power BI is that your data can be anywhere, maybe in an Excel spreadsheet or in the cloud or stored in a hybrid data warehouse. Still, with Power BI, you can connect all the data sources and get a cohesive representation of all the data.
Power BI includes several components that all work together, are:
- Power BI Desktop – A Windows desktop application
- Power BI Service – An online SaaS (Software as a Service)
- Power BI Mobile apps for iOS, Android.
How to save time with Excel using Power BI
Excel users swear by the prowess of this tool when it comes to data analytics, and there is no other platform that can beat MS excel. The combination of Power BI and Excel together expands the visualization capabilities and makes the data analytics more transparent and crystal clear.
Here are the things on how these two tools can benefit you if they work together:
No new software upgrade required:
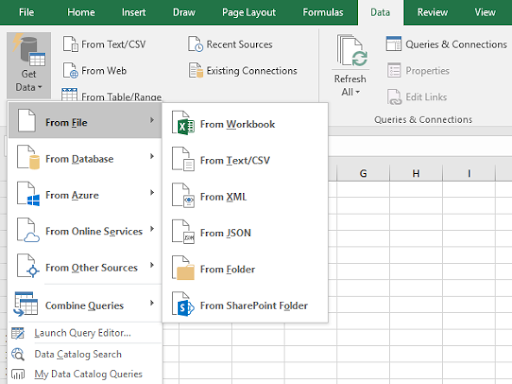
Power BI is a product of Microsoft, and so is Excel, making connecting these two platforms very feasible. You can quickly transfer all the data reports, models, and queries from Excel to the Power BI platform and create interactive analytics reports.
Use multiple workbooks in a single view.
You can connect your multiple Excel workbooks and get detailed analysis on one single Power BI dashboard – ranging from tables, data, and charts.
Get self-service data visualization.
The AI infrastructure of Power BI enables you to ask queries related to your Excel data models, which is a massive benefit for team members and colleagues of varying experience and knowledge levels. In addition, AI capabilities can help make better business decisions through easy data exploration, finding answers, and identifying data patterns.
Below are the 4 AI-powered features in Power BI:
- Text analytics and Image recognition
- Key Driver Analysis that helps provide insights on what drives critical business metrics.
- Seamless integration of Azure Machine Learning within Power BI
- Automated machine learning feature aids users to create ML models directly in Power BI
Add advanced analytics to your models
Power BI also supports complex data management systems and uses data mining and BI system to identify data patterns. So if your data models are complex and you need efficient data visualization, then Power BI has got you covered. It offers advanced custom visualization, modeling, and predictive capabilities for advanced analytics workflows by running R scripts and using R-powered custom visuals.
Maintain the flexibility of the grid
You can also work with Power BI data in Excel for ad-hoc analysis. You just need a single click and connect to your data models directly from Excel to create powerful PivotTables and charts with a single click.
Main differences between Excel and Power BI
- Excel is fundamentally used to manage data, transform it and perform calculations and other operations as needed. Power BI’s business intelligence and data visualization tool catering specifically to the needs of businesses.
- Excel fares stupendously well when performing operations and calculations on data, while Power BI is not that polished in this domain.
- Excel is limited when it comes to the amount of data it can [process. In contrast, Power BI can handle much more enormous amounts of data.
- You can connect Power BI to many data sources, while Excel’s connectivity capacity is limited.
- Power BI dashboards are interactive and customizable compared to Excel, which is more charts and graphs oriented.
- Power BI is a robust tool as the sole idea is to help businesses make sound business decisions, while Excel works professionally and personally.
How to choose which one to use?
Both tools deal with data, but very differently. Excel is your solution if your work is more about transforming data, performing complex mathematical operations, and creating complex tabular reports. On the other hand, Power BI comes with more business decision-oriented features. It should be your pick when you are:
- Working in a collaborative workspace
- Want to integrate data from several other data sources
- Deal with Big data
- Need to do data analysis to get insights into overall business performance or make critical business decisions.
Five questions to ask – if you are working with data and do not know which one should you pick?
1. Do I need to do a comprehensive data analysis? If your answer is Yes, Power BI is the best option.
2. Do I need reports in tabular format? In this case, you should use Excel and hire an Excel development company for clarity.
3. Do I work with extensive amounts of data? Power BI would support comprehensive data analysis needs.
4. Do I need interactive visualizations and graphics or simple charts? If you need interactive visualization, then power Bi is perfect other than that, Excel should be the tool you should go with.
5. Do I need to perform a lot of complex operations? If yes, then Excel is a better option.
At the bottom line, Excel is more diverse when performing operations on your data sets. Still, you will need a better tool when the data gets extremely extensive and is distributed across various sources. You need to get in touch with Excel consulting company that will understand your needs much better and help you make the right decision.
Get In Touch With Corporate Excel Developers Now!