Excel users often need to find unique values in a data field and conduct some sort of analysis on those unique values. The larger the data set, the more efficient this process needs to be. Most certainly, using the “Find” functionality on each value is the last thing anyone wants to do. Fortunately, Excel has several built-in tools that can help.
To demonstrate these built-in tools, we will find and analyze a list of unique routes in a data set of about 67,663 airline routes traveled by multiple airlines in these simple steps:
1. Use concatenation to create a route id for each record
2. Identify the duplicate route ids
3. Check the frequency of each route with a Pivot Table
4. Delete the duplicate route ids
The data set used in this example is the routes.csv file obtained from https://www.kaggle.com/jonathanbouchet/airlines-route-tracker/data
Step 1: Create a Route ID with concatenation
From the header and the first 7 records, we can see that the airports are identified by a 3-letter airport code (in the source and destination airport fields) and a numeric airport id. Either the airport code or the id can be used to identify the airport, but we will use the airport code for this exercise.

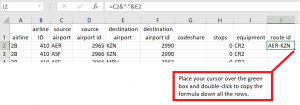
To create a route ID, we can concatenate the source and destination airport codes by placing the following formula in cell J2 and copying it down: =C2&”-“&E2.

Step 2: Identify Duplicate Route IDs
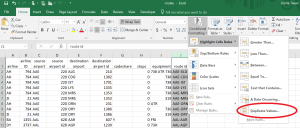
The next step is to identify and view duplicate routes using conditional formatting. In the Styles section of the ribbon, you will find Conditional Formatting/Highlight Cell Rules/Duplicate Values.
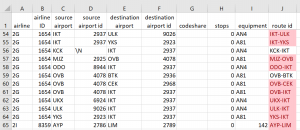
After the duplicate values are highlighted, you can see that the duplicates are not necessarily grouped together in the data set. If you would like to see them grouped together, sort the table by the route id.
Step 3: Conduct a Frequency Analysis with a Pivot Table
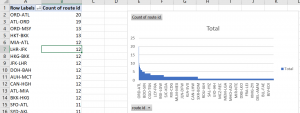
To find the number of airlines flying each route, we can count the frequency of each route, as it appears in the raw data set. An easy way to obtain this count is by creating a Pivot Table. Follow these steps to create a Pivot Table:
1.Select the entire table by selecting any single cell in the table and then using the keyboard shortcut, Ctrl A.
2.In the Insert Tab, select Pivot Table & Chart
a.In the popup, choose New Sheet
b.In the Pivot Table Fields list that appears on the right:
i.Drag route id to the Rows box
ii. Drag route id to the Sum Values box
3.In the Pivot Chart, select a value in the count of route id column, right click and select sort in descending order.
With the pivot table, you can also easily compare counts of routes going between the same airports, but in opposite directions. For instance, there are 20 flights going from ORD to ATL, but only 19 going from ATL to ORD.
Step 4: Create a List of Unique Values
For this exercise, the final task is to create a list of unique routes. This list may be needed for some other purpose, such as populating a routes table in a database. These simple steps make use of Excel’s “Remove Duplicates” functionality:
1. Copy the data set to a different tab.
2. Select the entire table, as before.
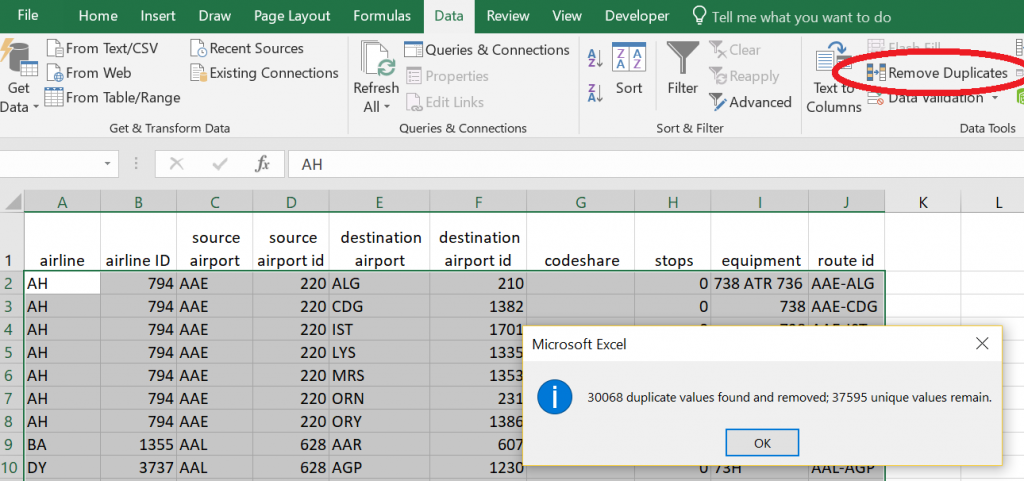
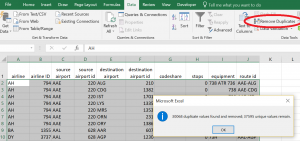
3. In the Data Tools section of the Data Tab, select “Remove Duplicates”
The popup below shows that 37,595 unique values remain.
Contact ExcelHelp.com for A Free Consultation
Let us help you design and develop a Rock-Solid solution for your firm. Contact our team to schedule a free consultation by calling 1-800-682-0882 or visit our website at ExcelHelp.com to submit an inquiry online.
